After returning from the datacenter, I start working on the migration. The initial steps are nothing but ordinary:
blkdiscard -f /dev/sdb
).mkfs.vfat /dev/sdb1
, mkfs.ext4 /dev/sdb2
, pvcreate /dev/sdb3
.mount /dev/sdb2 /t
, rsync -aHAXx / /t
.mount /dev/sdb1 /t/boot/efi
, arch-chroot /t
, grub-install
(target is x86_64-efi
), update-grub
.vgextend pve /dev/sdb3
, pvmove /dev/sda3 /dev/sdb3
.At this point, a quick thought emerges: This is not the final drive to run the system on and is only here for the transitional period. A second migration is planned when the new SSD arrives. So why not take this chance and move the rootfs onto LVM as well?
With that in mind, I hit Ctrl-C to pvmove
, unbeknownst that it’s interruptible and terminating the pvmove
process only pauses the operation.
For a moment, I thought I successfully canceled it and tried to re-partition the new drive.
Since the new PV is still in use by the suspended pvmove
operation, the kernel would not accept any changes to /dev/sdb3
.
During this process, I deleted and recreated the new rootfs (/dev/sdb2
) and the new PV (/dev/sdb3
) many times, and even tried manually editing LVM metadata (via vgcfgbackup pve
, edit /etc/lvm/backup/pve
and vgcfgrestore pve
), before finally giving up and rebooting the system.
As a daily dose for a SysAdmin, the server didn’t boot up as expected. I fired up a browser to connect to the machine’s IPMI, only to find that the remote console feature for iDRAC 9 was locked behind a paywall for goodness’ sake. Thanks to God almighty Dell, things have been unnecessarily more complicated than ever before. I carefully recalled every step taken and quickly identified the problem - one important thing forgotten - GRUB was successfully reinstalled on the new EFI partition (which was somehow left intact during the whole fiddling process), pointing to the now-deleted new root partition, and so it’s now stuck with GRUB.
Fortunately, out of precaution, I had previously configured the IPMI with serial-over-LAN, so I at least still have serial access to the server with ipmitool
. This saved me from a trip back to the datacenter.
ipmitool -I lanplus -H <ip> -U <user> -P <password> sol activate
And better yet, this iDRAC 9 can change BIOS settings, most notably the boot order and one-time boot override. This definitely helped the most in the absence of that goddamn remote console.
After some trial and error, I got myself into the GRUB command line, and it didn’t look quite well:
grub rescue>
There’s pretty much just the ls
command, and it doesn’t even recognize the EFI partition (FAT32 filesystem). With some more twiddling, I found this “rescue mode” capable of reading ext4, which shed some light to the situation.
grub rescue> set root=(hd0,gpt2)
grub rescue> ls /boot/grub
fonts grub.cfg grubenv locale unicode.pf2 x86_64-efi
Now things began to turn to the upswing.
grub rescue> set prefix=/boot/grub
grub rescue> insmod normal
grub rescue> normal
In a few seconds, I was delighted to discover that the system was up and running, and continued migrating the rootfs.
After everything’s done, out of every precaution, I installed grub-efi-amd64-signed
, which provides a large, monolithic grubx64.efi
that has all the “optional” modules built-in, so it no longer relies on the filesystem for, e.g., LVM support, in case a similar disaster happens again.
When trying to remove the faulty drive from the server, I at first made a wrong recall for its position, and we instead pulled out a running large-capacity HDD. Luckily it was not damaged, so we quickly inserted it back. Thanks to ZFS’s design, it automatically triggered a resilver, which completed in just a blink.
# zpool status
pool: rpool
state: ONLINE
scan: resilvered 63.4M in 00:00:03 with 0 errors on Tue Mar 12 17:03:23 2024
If this were a hardware RAID, a tedious and time-consuming rebuild would have been inevitable. It’s only with ZFS that this rapid recovery is possible.
This incident was a good lesson for me, and some big takeaways I’d draw:
Plus, the correct way to cancel a pvmove
operation is in man 8 pvmove
, and it’s right at the 2nd paragraph of the Description section.
None of my Windows hosts (PCs and VMs) has their RDP port exposed to the public internet directly, and they’re all connected to my mesh VPN (which is out of scope for this blog article). My primary public internet entry gateway for the intranet runs Debian with fully manually configured iptables-based firewall, and I frequently work on it through SSH.
My goal is to expose the RDP port only to myself. There are a few obvious solutions eliminated for different reasons:
The question arises that if SSH access is sufficiently convenient, why not use it as an authentication and authorization mechanism? So I came up with this:
A pre-configured iptables rule set to allow RDP access from a specific IP set. For example:
*filter
:FORWARD DROP
-A FORWARD -d 192.0.2.1 -p tcp --dport 3389 -m set --set ibug -j ACCEPT
*nat
-A RDPForward -p tcp --dport 3389 -j DNAT --to-destination 192.0.2.1:3389
-A RDPForward -p udp --dport 3389 -j DNAT --to-destination 192.0.2.1:3389
A way to keep the client address in the set for the duration of the SSH session. I use SSH user rc file to proactively refresh it:
#!/bin/bash
# rwxr-xr-x ~/.ssh/rc
if [ -z "$BASH" ]; then
exec /bin/bash -- "$0" "$@"
exit 1
fi
_ssh_client="${SSH_CONNECTION%% *}"
_ppid="$(ps -o ppid= $(ps -o ppid= $PPID))"
nohup ~/.local/bin/_ssh_refresh_client "$_ssh_client" "$_ppid" &>/dev/null & exit 0
#!/bin/sh
# rwxr-xr-x ~/.local/bin/_ssh_refresh_client
_ssh_client="$1"
_ppid="$2"
while kill -0 "$_ppid" 2>/dev/null; do
sudo ipset -exist add ibug "$_ssh_client" timeout 300
sleep 60
done
exit 0
The idea is to refresh (ipset add
with timeout) the IPset entry as long as the SSH session remains. When SSH disconnects, the script stops refreshing and IPset will clean it up after the specified time.
To determine the presence of the associated SSH session, the scripts finds the PID of the “session manager process”. The “parent PID” is read twice because sshd
double-forks. The client address is conveniently provided in the environment variable, so putting all these together yields precisely what I need.
The only caveat is the use of sudo
, as ipset
requires CAP_NET_ADMIN
for interacting with the kernel network stack. It’s certainly possible to write an SUID binary as a wrapper, but for me configuring passwordless sudo for the ipset
command satisfies my demands.
So now whenever I need to RDP to my computer through this forwarded port on the public internet, I can just SSH into the gateway and it’ll automatically grant me 5 minutes of RDP access from this specific network. All traffic forwarding is done in the kernel with no extra encapsulation or encryption, ensuring the best possible performance for both the endpoints and the gateway router itself.
]]>limit_req
for rate-limiting requests, which does a decent job, except its documentation is not known for its conciseness, plus a few questionable design choices. I happen to have a specific need for this feature so I examined it a bit.
As always, everything begins with the documentation. A quick-start example is given:
http {
limit_req_zone $binary_remote_addr zone=one:10m rate=1r/s;
...
server {
...
location /search/ {
limit_req zone=one burst=5;
}
The basis is the limit_req_zone
directive, which defines a shared memory zone for storing the states of the rate-limiting. Its arguments include the key, the size and the name of the zone, followed by the average or sustained rate limit. The rate limit has two possible units: r/s
or r/m
. It also says
The limitation is done using the “leaky bucket” method.
So far so good, except the burst limit is … specified on where it’s used? Moving on for now.
The limit_req
directive specifies when the requests should be limited.
If the requests rate exceeds the rate configured for a zone, their processing is delayed such that requests are processed at a defined rate.
Seems pretty clear but slightly counter-intuitive. By default, burst requests are queued up and delayed until the rate is below the limit, whereas most common rate-limiting implementations would simply serve them.
I find it easier to understand this model with a queue. Each key defines a queue where items are popped at the specified rate (e.g. 1r/s
). Incoming requests are added to the queue, and are only served upon exiting the queue. The queue size is defined by the burst limit, and excess requests are dropped when the queue is full.
The more common behavior, however, requires an extra option:
If delaying of excessive requests while requests are being limited is not desired, the parameter
nodelay
should be used:limit_req zone=one burst=5 nodelay;
With nodelay
, requests are served as soon as they enter the queue:
The next confusing option, conflicting with nodelay
, is delay
:
The
delay
parameter specifies a limit at which excessive requests become delayed. Default value is zero, i.e. all excessive requests are delayed.
After a bit of fiddling, I realized the model is now like this:
So what delay
actually means is to delay requests after this “delay limit” is reached. In other words, requests are served as soon as they arrive at the n-th position in the front of the queue.
During all these testing, I wasn’t happy with existing tools for testing, so I wrote my own one, despite its simplicity: GitHub Gist.
With this new tool, I can now (textually) visualize the behavior of different options. Under the burst=5
and delay=1
setup, the output is like this:
$ go run main.go -i 10ms -c 10 http://localhost/test
[1] Done [0s] [200 in 2ms]
[2] Done [10ms] [200 in 1ms]
[3] Done [21ms] [200 in 981ms]
[4] Done [31ms] [200 in 1.972s]
[5] Done [42ms] [200 in 2.962s]
[6] Done [53ms] [200 in 3.948s]
[7] Done [64ms] [503 in 0s]
[8] Done [75ms] [503 in 1ms]
[9] Done [85ms] [503 in 0s]
[10] Done [95ms] [503 in 0s]
If you try the tool yourself, the HTTP status codes are colored for even better prominence.
In the above example, the first request is served immediately as it also exits the queue immediately. The second request is queued at the front, and because delay=1
, it’s also served immediately. Subsequent requests are queued up until the sixth when the queue becomes full. The seventh and thereafter are dropped.
If we change delay=0
, the output becomes:
$ go run main.go -i 10ms -c 10 http://localhost/test
[1] Done [0s] [200 in 2ms]
[2] Done [10ms] [200 in 993ms]
[3] Done [21ms] [200 in 1.982s]
[4] Done [32ms] [200 in 2.973s]
[5] Done [43ms] [200 in 3.959s]
[6] Done [54ms] [200 in 4.949s]
[7] Done [65ms] [503 in 1ms]
[8] Done [75ms] [503 in 1ms]
[9] Done [85ms] [503 in 2ms]
[10] Done [96ms] [503 in 1ms]
Still only the first 6 requests are served, but the 2nd to the 6th are delayed by an additional second due to the removal of delay=1
.
Under this model, the nodelay
option can be understood as delay=infinity
, while still respecting the burst
limit.
Why is the burst limit specified at use time, instead of at zone definition? Only experiments can find out:
location /a {
limit_req zone=test burst=1;
}
location /b {
limit_req zone=test burst=5;
}
Then I fire up two simultaneous batches of 10 requests each to /a
and /b
respectively:
$ go run main.go -i 10ms -c 10 http://localhost/a
[1] Done [0s] [200 in 2ms]
[2] Done [10ms] [200 in 992ms]
[3] Done [21ms] [503 in 0s]
[4] Done [32ms] [503 in 0s]
[5] Done [42ms] [503 in 0s]
[6] Done [53ms] [503 in 0s]
[7] Done [63ms] [503 in 0s]
[8] Done [73ms] [503 in 0s]
[9] Done [83ms] [503 in 0s]
[10] Done [94ms] [503 in 0s]
$ go run main.go -i 10ms -c 10 http://localhost/b
[1] Done [0s] [200 in 1.862s]
[2] Done [11ms] [200 in 2.852s]
[3] Done [21ms] [200 in 3.842s]
[4] Done [32ms] [200 in 4.832s]
[5] Done [43ms] [503 in 1ms]
[6] Done [54ms] [503 in 0s]
[7] Done [64ms] [503 in 0s]
[8] Done [75ms] [503 in 1ms]
[9] Done [85ms] [503 in 0s]
[10] Done [95ms] [503 in 1ms]
As can be seen from the output, the batch to /a
is served as usual, but the batch to /b
is significantly delayed, and two fewer requests are served.
If I reverse the order of sending the batches, the result is different again:
$ go run main.go -i 10ms -c 10 http://localhost/b
[1] Done [0s] [200 in 2ms]
[2] Done [10ms] [200 in 993ms]
[3] Done [20ms] [200 in 1.982s]
[4] Done [31ms] [200 in 2.974s]
[5] Done [42ms] [200 in 3.963s]
[6] Done [52ms] [200 in 4.955s]
[7] Done [63ms] [503 in 0s]
[8] Done [74ms] [503 in 0s]
[9] Done [84ms] [503 in 0s]
[10] Done [95ms] [503 in 0s]
$ go run main.go -i 10ms -c 10 http://localhost/a
[1] Done [0s] [503 in 1ms]
[2] Done [10ms] [503 in 1ms]
[3] Done [20ms] [503 in 0s]
[4] Done [31ms] [503 in 0s]
[5] Done [42ms] [503 in 0s]
[6] Done [52ms] [503 in 0s]
[7] Done [63ms] [503 in 1ms]
[8] Done [73ms] [503 in 0s]
[9] Done [83ms] [503 in 0s]
[10] Done [93ms] [503 in 0s]
This time the batch to /b
is served as usual, but the entire batch to /a
is rejected.
I am now convinced that the queue itself is shared between /a
and /b
, and each limit_req
directive decides for itself whether and when to serve the requests. So when /a
is served first, the queue holds one burst request, and /b
fills the queue up to 5 requests. When /b
is served first, the queue is already holding 5 requests and leaves no room for /a
. Similarly, with the delay
option, each limit_req
directive can still decide when the request is ready to serve.
This is probably not the most straightforward design, and I can’t come up with a use case for this behavior. But at least now I understand how it works.
I originally wanted to set up a 403 page for banned clients, and wanted to limit the rate of log writing in case of an influx of requests. The limit_req module does provide a $limit_req_status
variable which appears to be useful. This is what I ended up with:
limit_req_zone $binary_remote_addr zone=403:64k rate=1r/s;
map $limit_req_status $loggable_403 {
default 0;
PASSED 1;
DELAYED 1;
DELAYED_DRY_RUN 1;
}
server {
access_log /var/log/nginx/403/access.log main if=$loggable_403;
error_log /var/log/nginx/403/error.log warn;
error_page 403 /403.html;
error_page 404 =403 /403.html;
limit_req zone=403;
limit_req_status 403;
limit_req_log_level info;
location / {
return 403;
}
location = /403.html {
internal;
root /srv/nginx;
sub_filter "%remote_addr%" "$remote_addr";
sub_filter_once off;
}
}
With this setup, excessive requests are rejected by limit_req
with a 403 status. Only 1r/s
passes through the rate limiting, which will carry the PASSED
status and be logged, albeit still seeing the 403 page from the return 403
rule. This does exactly what I want, so time to call it a day.
I choose CaiYun Weather (彩云天气) API for having previous experience with it, as well as its unlimited free tier. I must admit that I initially came up with this idea for having seen the presence of JSON API datasource plugin for Grafana, which reminds me of CaiYun’s JSON API being a perfect fit.
Configuring the datasource seems easy at first, like just inserting the URL and configure HTTP headers as needed. Since CY’s API puts the API key in the URL path, there’s no headers to configure. So I can just put a single URL and save it.
https://api.caiyunapp.com/v2.5/TAkhjf8d1nlSlspN/121.6544,25.1552/hourly.json
I choose the hourly API so I can have forecast for the upcoming 48 hours.
So far this is a readily available datasource that I can query. But after reviewing the JSON query editor, I decided to chop off the last segments of the URL and leave just the part up to the API key:
https://api.caiyunapp.com/v2.5/TAkhjf8d1nlSlspN/
The point here is, the query editor allows specifying an extra Path, which appears to be concatenated with this URL in the datasource configuration. Notably, I can then put the coordinates in a variable, use it in the query, and build a single dashboard for many cities.
Now that I have the query format planned, I can add a dashboard variable for selecting cities.
First things first, since I’m going to use the same datasource for all panels, I first add a variable for the datasource and restrict it to “CaiYun Weather”:
Then I add a variable $location
for the city name, and provide it with a list of cities I want to show. The variable type would be “Custom” since this is just a human-maintained list. There certainly are better ways like using a relational database or an external API, making it easier to update, but for now I’d like to keep it simple.
Beijing : 116.4074\,39.9042,Shanghai : 121.4691\,31.2243,Guangzhou : 113.2644\,23.1291,Shenzhen : 114.0596\,22.5429
First and foremost, the most intuitive metric to show is temperature. I add a time series panel and configure it to graph the temperature. Start by building the query:
${datasource}
/${location}/hourly.json
$.result.hourly.temperature[*].value
, Type: Number
, Alias: ${location:text}
$.result.hourly.temperature[*].datetime
, Type: Time
I stumbled on getting the time series to display correctly. It wasn’t anywhere obvious in the documentation for the JSON API plugin, but a series with Type = Time is required. Fortunately, CY’s API returns the time in ISO 8601 format in the datetime
field, so I can feed it directly to Grafana.
So far so good, except Grafana shows “No data”. I realized Grafana is trying to show past data, but apparently a weather forecast provides future data. I need to change the time range to “now” and “now + 48h”. Ideally, this time range is fixed and not affected by the time range selector, since after all it’s limited by the API.
This is another place where I spent half an hour on Google. The answer is “Relative time” in “Query options”. Its format, however, is again unintuitive. While community posts shows 1d
for “last 1 day” and the official docs gives several examples on using now
, none of them told me how to indicate “next 48 hours”. The answer is just +48h
or +2d
. Notably, entering now+48h
would result in an error.
To make the graph look nicer, I set the unit to “°C”, limit decimals to 1, and set the Y-axis range to 0-40, and add a series of thresholds with colors to indicate the temperature range. Also worth mentioning is to make the graph change its color according to the temperature, so I set “Graph style → Gradient mode” to “Scheme” and “Standard options → Color scheme” to “From thresholds (by value)”.
Now this panel looks stunning.
CY’s API offers a variety of weather data, so with little effort I can add more panels for humidity, precipitation and more, by duplicating the temperature panel and changing the query. I also need to change the unit and thresholds accordingly but that goes without saying.
There’s also a small piece worth displaying: A description
text. It’s easy to put it in a “Stat” panel and display as “String” (instead of “Number”). And better yet, CY provides two descriptions: One for the next two hours, and one for the next two days. Two panels for two pieces of text, yeah.
One last thing I decided to leave out for now: The skycon
field that describes the weather condition, like “CLEAR_DAY” or “RAIN”. It’d be comparably easy to add a panel for it, using “Value mapping” to change the text to something more human-readable, but I’m not at the high mood for it right now, so maybe I’ll pick it up later.
Now I have a nice dashboard for viewing weather forecast for multiple cities:
If you’d like to try it yourself, I’ve published the dashboard on Grafana.com: Weather Forecast. Just add the same datasource with your API key, and you can import my dashboard and start getting weather forecast for yourself.
]]>We’ll begin with a slide from a ZFS talk from Lustre1 (page 5):
The first thing to understand is that there are at least two levels of “block” concepts in ZFS. There’s “logical blocks” on an upper layer (DMU), and “physical blocks” on a lower layer (vdev). The latter is easier to understand and it’s almost synonymous to “disk sectors”. It’s precisely the ashift
parameter in zpool create
command and usually matches the physical sector size of your disks (4 KiB for modern disks). Once set, ashift
is immutable and can only be changed when recreating the entire vdev array (fortunately not the entire pool2). The “logical block”, however, is slightly more complicated, and beyond the expressibility of a few words. In short, it’s the smallest meaningful unit of data that ZFS can operate on, including reading, writing, checksumming, compression and deduplication.
You’ve probably seen recordsize
being talked about extensively in ZFS tuning guides3, which is already a great source of confusion. The default recordsize
is 128 KiB, which controls the maximum size of a logical block. The actual block size depends on the file you’re writing:
recordsize
, it’s stored as a single logical block of its size, rounded up to the nearest multiple of 512 bytes.recordsize
, it’s split into multiple logical blocks of recordsize
each, with the last block being zero-padded to recordsize
.As with other filesystems, if you change a small portion of a large file, only 128 KiB (or whatever your recordsize
is) is rewritten, along with new metadata and checksums. Large recordsize
bloats the read/write amplification for random I/O workloads, while small recordsize
increases the fragmentation and metadata overhead for large files. Note that ZFS always validates checksums, so every read operation is done on an entire block, even if only a few bytes are requested. So it is important to align your recordsize
with your workload, like using 16 KiB for (most) databases and 1 MiB for media files. The default 128 KiB is a good compromise for general-purpose workloads, and there certainly isn’t a one-size-fits-all solution. Also note that while recordsize
can be changed on the fly, it only affects newly written data, and existing ones stay intact.
For ZVOLs, as you’d imagine, the rule is much simpler: Every block of volblocksize
is a logical block, and it’s aligned to its own size. Since ZFS 2.2, the default volblocksize
is 16 KiB, providing a good balance between performance and compatibility.
Compression is applied on a per-block basis, and compressed data is not shared between blocks. This is best shown with an example:
$ zfs get compression tank/test
NAME PROPERTY VALUE SOURCE
tank/test compression zstd inherited from tank
$ head -c 131072 /dev/urandom > 128k
$ cat 128k 128k 128k 128k 128k 128k 128k 128k > 1m
$ du -sh 128k 1m
129K 128k
1.1M 1m
$ head -c 16384 /dev/urandom > 16k
$ cat 16k 16k 16k 16k 16k 16k 16k 16k > 128k1
$ cat 128k1 128k1 128k1 128k1 128k1 128k1 128k1 128k1 > 1m1
$ du -sh 16k 128k1 1m1
17K 16k
21K 128k1
169K 1m1
As you can see from du
’s output above, despite containing 8 identical copies of the same 128 KiB random data, the 1 MiB file gains precisely nothing from compression, as each 128 KiB block is compressed individually. The other test of combining 8 copies of 16 KiB random data into one 128 KiB file shows positive results, as the 128 KiB file is only 21 KiB in size. Similarly, the 1 MiB file that contains 64 exact copies of the same 16 KiB chunk is exactly 8 times the size of that 128 KiB file, because the chunk data is not shared across 128 KiB boundaries.
This brings up an interesting point: It’s beneficial to turn on compression even for filesystems with uncompressible data4. One direct impact is on the last block of a large file, where its zero-filled bytes up to recordsize
compress very well. Using LZ4 or ZSTD, compression should have negligible impact on any reasonably modern CPU and reasonably sized disks.
There are two more noteworthy points about compression, both from man zfsprops.7
:
When any setting except off is selected, compression will explicitly check for blocks consisting of only zeroes (the NUL byte). When a zero-filled block is detected, it is stored as a hole and not compressed using the indicated compression algorithm.
Instead of compressing entire blocks of zeroes like the last block of a large file, ZFS will not store anything about these zero blocks. Technically, this is done by omitting the corresponding ranges from the file’s indirect blocks4.
Take this test for example: I created a file with 64 KiB of urandom, then 256 KiB of zeroes, then another 64 KiB of urandom. The file is 384 KiB in size, but only 128 KiB is actually stored on disk:
# zfs create pool0/srv/test
# cat <(head -c 64K /dev/urandom) <(head -c 256K /dev/zero) <(head -c 64K /dev/urandom) > /srv/test/test
# du -sh /srv/test/test
145K /srv/test/test
We can also examine the file’s indirect blocks with zdb
:
# ls -li /srv/test/test
2 -rw-r--r-- 1 root root 393216 Oct 30 02:05 /srv/test/test
# zdb -ddddd pool0/srv/test 2
[...]
Indirect blocks:
0 L1 0:1791b7d3000:1000 20000L/1000P F=2 B=9769680/9769680 cksum=[...]
0 L0 0:1791b7b1000:11000 20000L/11000P F=1 B=9769680/9769680 cksum=[...]
40000 L0 0:1791b7c2000:11000 20000L/11000P F=1 B=9769680/9769680 cksum=[...]
segment [0000000000000000, 0000000000020000) size 128K
segment [0000000000040000, 0000000000060000) size 128K
Here we can see only two L0 blocks allocated, each being 20000 (hex, dec = 131072) bytes logical and 11000 (hex, dec = 69632) bytes physical in size. The two L0 blocks match the two segments shown at the bottom, with the middle segment nowhere to be found.
Any block being compressed must be no larger than 7/8 of its original size after compression, otherwise the compression will not be considered worthwhile and the block saved uncompressed. […] for example, 8 KiB blocks on disks with 4 KiB disk sectors must compress to 1/2 or less of their original size.
This one should be self-explanatory.
Up until now we’ve only talked about logical blocks, which are all on the higher layers of the ZFS hierarchy. RAIDZ is where physical blocks (disk sectors) really come into play and adds another field of confusion.
Unlike traditional RAID 5/6/7(?) that combine disks into an array and presents a single volume for the filesystem, RAIDZ handles each logical block separately. I’ll cite this illustration from Delphix5 to explain:
This example shows a 5-wide RAID-Z1 setup.
Multi-sector blocks are striped across disks, with parity sectors inserted every 4 sectors, matching the data-to-parity ratio of the vdev array.
This design allows RAID to play well with ZFS’s log-structured design and avoids the need for read-modify-write cycles. Consequently, the RAID overhead is now dependent on your data and is no longer an intrinsic property of the RAID level and array width. The same Delphix article shares a nice spreadsheet6 that calculates RAID overhead for you:
Accounting the storage space for a RAIDZ array is as problematic as it seems: There’s no way to calculate the available space in advance without knowledge on the block size pattern.
ZFS works around this by showing an estimate, assuming all data were stored as 128 KiB blocks7. On my test setup with five 16 GiB disks in RAID-Z1 and ashift=12
, the available space shows as 61.5G, while zpool
shows the raw size as 79.5G:
# zpool create -o ashift=12 test raidz1 nvme3n1p{1,2,3,4,5}
# zfs list test
NAME USED AVAIL REFER MOUNTPOINT
test 614K 61.5G 153K /test
# zpool list test
NAME SIZE ALLOC FREE CKPOINT EXPANDSZ FRAG CAP DEDUP HEALTH ALTROOT
test 79.5G 768K 79.5G - - 0% 0% 1.00x ONLINE -
When I increase ashift
to 15 (32 KiB sectors), the available space drops quite a bit, even if zpool
shows the same raw size:
# zpool create -o ashift=15 test raidz1 nvme3n1p{1,2,3,4,5}
# zfs list test
NAME USED AVAIL REFER MOUNTPOINT
test 4.00M 51.3G 1023K /test
# zpool list test
NAME SIZE ALLOC FREE CKPOINT EXPANDSZ FRAG CAP DEDUP HEALTH ALTROOT
test 79.5G 7.31M 79.5G - - 0% 0% 1.00x ONLINE -
In both cases, calculating the “raw” disk space from the available space gives roughly congruent results:
The default refreservation
for non-sparse ZVOLs exhibits a similar behavior:
# zfs create -V 4G -o volblocksize=8K test/v8k
# zfs create -V 4G -o volblocksize=16K test/v16k
# zfs get refreservation test/v8k test/v16k
NAME PROPERTY VALUE SOURCE
test/v16k refreservation 4.86G local
test/v8k refreservation 6.53G local
Interestingly, neither of the refreservation
sizes matches the RAID overhead as calculated in the Delphix spreadsheet6, as you would expect some 6.0 GiB for the 16k-volblocksized ZVOL and some 8.0 GiB for the 8k-volblocksized one. Let’s just don’t forget that the whole accounting system assumed 128 KiB blocks and scaled by that8. So the actual meaning of 4.86G and 6.53G would be “the equivalent space if volblocksize had been 128 KiB”. If we multiply both values by 1.25 (overhead for 128 KiB blocks and 5-wide RAIDZ), we get 6.08 GiB and 8.16 GiB of raw disk spaces respectively, both of which match more closely the expected values. The final minor difference is due to the different amount of metadata required for different number of blocks.
I never imagined I would delve this deep into ZFS when I first stumbled upon the question. There are lots of good write-ups on individual components of ZFS all around the web, and Chris Siebenmann’s blog in particular. But few combine all the pieces together and paint the whole picture, so I had to spend some time synthesizing them by myself. As you’ve seen in the Luster slide, ZFS is so complex a beast that it’s hard to digest in its entirety. So for now I have no idea how much effort I would put into learning it, nor any future blogs I would write. But anyways, that’s one large mystery solved, for myself and my readers (you), and time to call it a day.
Andreas Dilger (2010) ZFS Features & Concepts TOI ↩
Jim Salter (2020) ZFS 101 – Understanding ZFS storage and performance ↩
OpenZFS Workload Tuning ↩
Chris Siebenmann (2017) ZFS’s recordsize, holes in files, and partial blocks ↩ ↩2
Matthew Ahrens (2014) How I Learned to Stop Worrying and Love RAIDZ ↩
RAID-Z parity cost (Google Sheets) ↩ ↩2
openzfs/zfs#4599 (2016) disk usage wrong when using larger recordsize, raidz and ashift=12 ↩
Mike Gerdts (2019) (Code comment in libzfs_dataset.c
) ↩
When I reviewed my edited Nginx configuration and tried visiting the new website, I received a 504 Gateway Timeout error after curl
hung for a minute. Knowing that the web server had yet to be set up, I was expecting a 502 Bad Gateway error. I quickly recalled the conditions for Nginx to return these specific errors: 502 if the upstream server is immediately known down, and 504 if the upstream server is up but not responding.
Since the actual web application hadn’t been set up yet, the new VM should have nothing listening on the configured ports. Consequently, the kernel should immediately respond with a TCP Reset for any incoming connections. To verify this, I ran tcpdump
on both sides to check if the TCP reset packets actually came out. To my surprise, the packets were indeed sent out from the new VM, but the gateway server received nothing. So there was certainly something wrong with the firewall. I took a glance at the output of pve-firewall compile
. They were very structured and adequately easy to understand, but I couldn’t immediately identify anything wrong. Things were apparently more complicated than I had previously anticipated.
As usual, the first thing to try is Googling. Searching for pve firewall tcp reset
brought this post on Proxmox Forum as the first result. Their symptoms were precisely the same as mine:
- Assume we have a service running on TCP port 12354
- Clients can communicate with it while running
- While service is down, clients recieved “Connection timed out” (no answer) even if OS send TCP RST packets:
[…]
However, these RST packets are dropped somewhere in PVE firewall.
On the VM options :
- Firewall > Options > Firewall = No, Has no effect
- Firewall > Options > * Policy = ACCEPT, Has no effect (even with NO rule in active for this VM)
- Hardware > Network Device >
firewall=0
, allows packets RST to pass!
I gave the last suggestion a try, and it worked! I could now see connections immediately reset on the gateway server, and Nginx started producing 502 errors. But I was still confused why this happened in the first place. The first thread contained nothing else useful, so I continued scanning through other search results and noticed another post about another seemingly unrelated problem, with a plausible solution:
[…], and the fix was just to add the
nf_conntrack_allow_invalid: 1
in thehost.fw
for each node - I didn’t have to do anything other than that.
That seemed understandable to me, so I gave it a try as well, and to my pleasure, it also worked.
Regrettably, useful information ceased to exist online beyond this, and it was far from painting the whole picture. So anything further would have to be uncovered on my own.
I reviewed the two helpful workarounds and made myself abundantly clear about their effects:
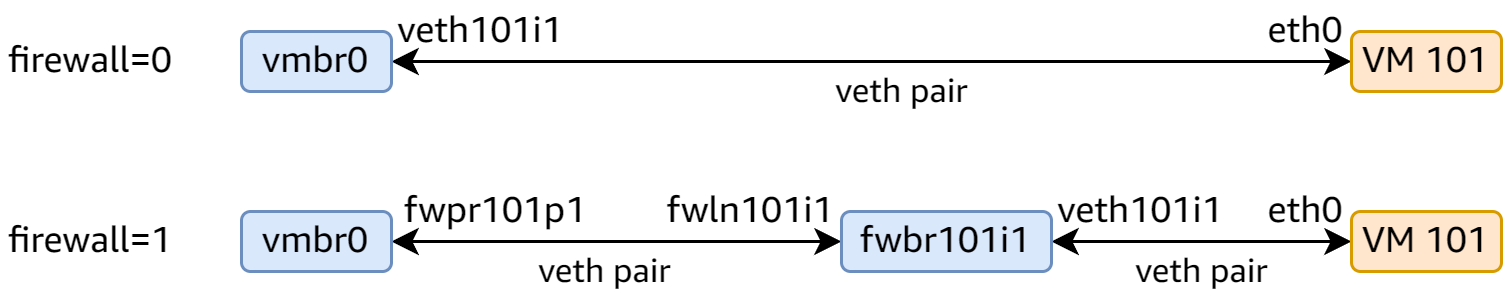
Disabling the firewall on the virtual network device stops PVE from bridging the interface an extra time, as shown in the following diagram:
Adding nf_conntrack_allow_invalid: 1
removes one single iptables rule:
-A PVEFW-FORWARD -m conntrack --ctstate INVALID -j DROP
I couldn’t figure out how the first difference was relevant, but the second one provided an important clue: The firewall was dropping TCP Reset packets because conntrack considered them invalid.
Conntrack (connection tracking) is a Linux kernel subsystem that tracks network connections and aids in stateful packet inspection and network address translation. The first packet of a connection is considered “NEW”, and subsequent packets from the same connection are considered “ESTABLISHED”, including the TCP Reset packet when it’s first seen, which causes conntrack to delete the connection entry.
There was still yet anything obvious, so time to start debugging.
I ran tcpdump -ni any host 172.31.0.2 and host 172.31.1.11 and tcp
on the PVE host to capture packets between the two VMs. This is what I got (output trimmed):
tcpdump: data link type LINUX_SLL2
tcpdump: verbose output suppressed, use -v[v]... for full protocol decode
listening on any, link-type LINUX_SLL2 (Linux cooked v2), snapshot length 262144 bytes
16:33:11.911184 veth101i1 P IP 172.31.0.2.50198 > 172.31.1.11.80: Flags [S], seq 3404503761, win 64240
16:33:11.911202 fwln101i1 Out IP 172.31.0.2.50198 > 172.31.1.11.80: Flags [S], seq 3404503761, win 64240
16:33:11.911203 fwpr101p1 P IP 172.31.0.2.50198 > 172.31.1.11.80: Flags [S], seq 3404503761, win 64240
16:33:11.911206 fwpr811p0 Out IP 172.31.0.2.50198 > 172.31.1.11.80: Flags [S], seq 3404503761, win 64240
16:33:11.911207 fwln811i0 P IP 172.31.0.2.50198 > 172.31.1.11.80: Flags [S], seq 3404503761, win 64240
16:33:11.911213 tap811i0 Out IP 172.31.0.2.50198 > 172.31.1.11.80: Flags [S], seq 3404503761, win 64240
16:33:11.911262 tap811i0 P IP 172.31.1.11.80 > 172.31.0.2.50198: Flags [R.], seq 0, ack 3404503762, win 0, length 0
16:33:11.911267 fwln811i0 Out IP 172.31.1.11.80 > 172.31.0.2.50198: Flags [R.], seq 0, ack 1, win 0, length 0
16:33:11.911269 fwpr811p0 P IP 172.31.1.11.80 > 172.31.0.2.50198: Flags [R.], seq 0, ack 1, win 0, length 0
^C
9 packets captured
178 packets received by filter
0 packets dropped by kernel
The first thing to notice is the ACK number. After coming from tap811i0
, it suddenly became 1 with no apparent reason. I struggled on this for a good while and temporarily put it aside.
Adding nf_conntrack_allow_invalid: 1
to the firewall options and capturing packets again, I got the following:
listening on any, link-type LINUX_SLL2 (Linux cooked v2), snapshot length 262144 bytes
16:46:15.243002 veth101i1 P IP 172.31.0.2.58784 > 172.31.1.11.80: Flags [S], seq 301948896, win 64240
16:46:15.243015 fwln101i1 Out IP 172.31.0.2.58784 > 172.31.1.11.80: Flags [S], seq 301948896, win 64240
16:46:15.243016 fwpr101p1 P IP 172.31.0.2.58784 > 172.31.1.11.80: Flags [S], seq 301948896, win 64240
16:46:15.243020 fwpr811p0 Out IP 172.31.0.2.58784 > 172.31.1.11.80: Flags [S], seq 301948896, win 64240
16:46:15.243021 fwln811i0 P IP 172.31.0.2.58784 > 172.31.1.11.80: Flags [S], seq 301948896, win 64240
16:46:15.243027 tap811i0 Out IP 172.31.0.2.58784 > 172.31.1.11.80: Flags [S], seq 301948896, win 64240
16:46:15.243076 tap811i0 P IP 172.31.1.11.80 > 172.31.0.2.58784: Flags [R.], seq 0, ack 301948897, win 0, length 0
16:46:15.243081 fwln811i0 Out IP 172.31.1.11.80 > 172.31.0.2.58784: Flags [R.], seq 0, ack 1, win 0, length 0
16:46:15.243083 fwpr811p0 P IP 172.31.1.11.80 > 172.31.0.2.58784: Flags [R.], seq 0, ack 1, win 0, length 0
16:46:15.243086 fwpr101p1 Out IP 172.31.1.11.80 > 172.31.0.2.58784: Flags [R.], seq 0, ack 1, win 0, length 0
16:46:15.243087 fwln101i1 P IP 172.31.1.11.80 > 172.31.0.2.58784: Flags [R.], seq 0, ack 1, win 0, length 0
16:46:15.243090 veth101i1 Out IP 172.31.1.11.80 > 172.31.0.2.58784: Flags [R.], seq 0, ack 1, win 0, length 0
^C
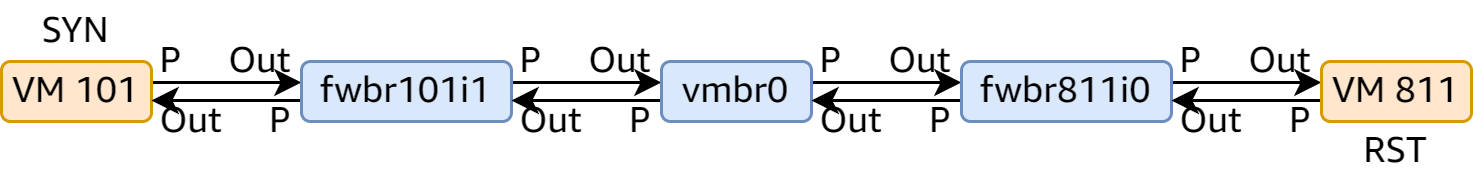
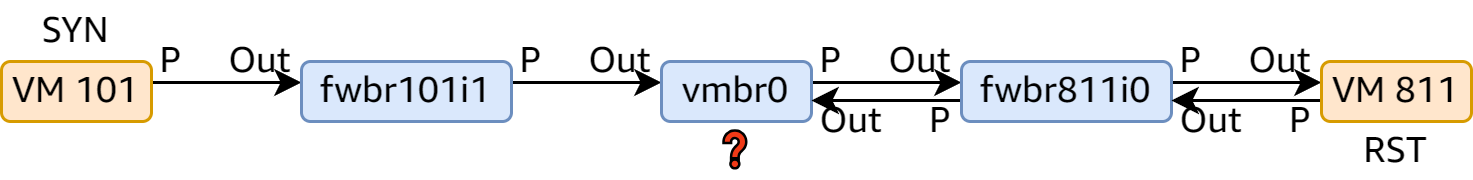
This time while the ACK number was still wrong, the RST packet somehow got through. Ignoring the ACK numbers for now, the output suggested that the RST packet was dropped between fwpr811p0 P
and fwln811i0 Out
. That was the main bridge vmbr0
. All right then, that was where the PVEFW-FORWARD
chain kicked in, so at this point the RST packet was --ctstate INVALID
. Everything was logical so far.
So how about disabling firewall for the interface on VM 811?
listening on any, link-type LINUX_SLL2 (Linux cooked v2), snapshot length 262144 bytes
17:19:01.812030 veth101i1 P IP 172.31.0.2.39734 > 172.31.1.11.80: Flags [S], seq 1128018611, win 64240
17:19:01.812045 fwln101i1 Out IP 172.31.0.2.39734 > 172.31.1.11.80: Flags [S], seq 1128018611, win 64240
17:19:01.812046 fwpr101p1 P IP 172.31.0.2.39734 > 172.31.1.11.80: Flags [S], seq 1128018611, win 64240
17:19:01.812051 tap811i0 Out IP 172.31.0.2.39734 > 172.31.1.11.80: Flags [S], seq 1128018611, win 64240
17:19:01.812178 tap811i0 P IP 172.31.1.11.80 > 172.31.0.2.39734: Flags [R.], seq 0, ack 1128018612, win 0, length 0
17:19:01.812183 fwpr101p1 Out IP 172.31.1.11.80 > 172.31.0.2.39734: Flags [R.], seq 0, ack 1, win 0, length 0
17:19:01.812185 fwln101i1 P IP 172.31.1.11.80 > 172.31.0.2.39734: Flags [R.], seq 0, ack 1, win 0, length 0
17:19:01.812190 veth101i1 Out IP 172.31.1.11.80 > 172.31.0.2.39734: Flags [R.], seq 0, ack 1, win 0, length 0
^C
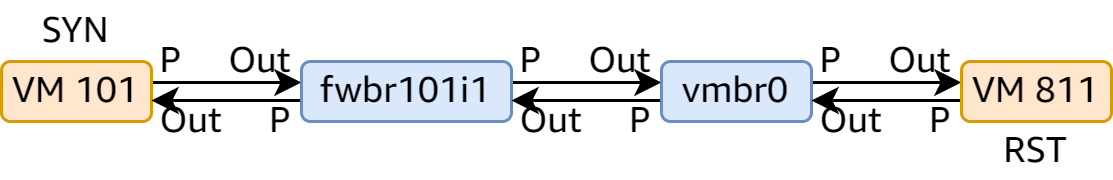
This time fwbr811i0
was missing, and the RST packet didn’t get dropped at vmbr0
. I was left totally confused.
I decided to sort out the ACK number issue, but ended up asking my friends for help. It turned out this was well documented in tcpdump(8)
:
-S
--absolute-tcp-sequence-numbers
Print absolute, rather than relative, TCP sequence numbers.
This certainly came out unexpected, but at least I was assured there was nothing wrong with the ACK numbers.
Up to now, that’s one more step forward, and a small conclusion:
vmbr0
, it was already --ctstate INVALID
.But how? As far as I knew, when the RST packet came out, it should still be considered part of the connection, and thus should be --ctstate ESTABLISHED
. I was still missing something.
Time to investigate conntrack.
conntrack
is the tool to inspect and modify conntrack entries. I ran conntrack -L
to list all entries, only to realize it’s inefficient. So instead, I ran conntrack -E
to watch for “events” in real time, so that I could compare the output with tcpdump
. Except that the entire connection concluded so quickly that I couldn’t identify anything.
I had to add artificial delays to the packets to clearly separate each hop that the RST packet goes through:
tc qdisc add dev tap811i0 root netem delay 200ms
tc qdisc add dev fwln811i0 root netem delay 200ms
I also tuned the output on both sides to show the timestamp in a consistent format. For conntrack, -o timestamp
produced Unix timestamps (which is the only supported format), so for tcpdump
I also resorted to -tt
to show Unix timestamps as well.
conntrack -E -o timestamp -s 172.31.0.2 -d 172.31.1.11
tcpdump -ttSni any host 172.31.0.2 and host 172.31.1.11 and tcp
Now I could watch the outputs on two separate tmux panes. The problem immediately emerged (blank lines added for readability):
listening on any, link-type LINUX_SLL2 (Linux cooked v2), snapshot length 262144 bytes
1696412047.886575 veth101i1 P IP 172.31.0.2.47066 > 172.31.1.11.80: Flags [S]
1696412047.886592 fwln101i1 Out IP 172.31.0.2.47066 > 172.31.1.11.80: Flags [S]
1696412047.886594 fwpr101p1 P IP 172.31.0.2.47066 > 172.31.1.11.80: Flags [S]
1696412047.886599 fwpr811p0 Out IP 172.31.0.2.47066 > 172.31.1.11.80: Flags [S]
1696412047.886600 fwln811i0 P IP 172.31.0.2.47066 > 172.31.1.11.80: Flags [S]
1696412048.086620 tap811i0 Out IP 172.31.0.2.47066 > 172.31.1.11.80: Flags [S]
1696412048.086841 tap811i0 P IP 172.31.1.11.80 > 172.31.0.2.47066: Flags [R.]
1696412048.286919 fwln811i0 Out IP 172.31.1.11.80 > 172.31.0.2.47066: Flags [R.]
1696412048.286930 fwpr811p0 P IP 172.31.1.11.80 > 172.31.0.2.47066: Flags [R.]
^C
[1696412047.886657] [NEW] tcp 6 120 SYN_SENT src=172.31.0.2 dst=172.31.1.11 sport=47066 dport=80 [UNREPLIED] src=172.31.1.11 dst=172.31.0.2 sport=80 dport=47066
[1696412048.086899] [DESTROY] tcp 6 119 CLOSE src=172.31.0.2 dst=172.31.1.11 sport=47066 dport=80 [UNREPLIED] src=172.31.1.11 dst=172.31.0.2 sport=80 dport=47066
The artificial delays and the timestamps were absolutely useful: It was clear that the corresponding conntrack connection was destroyed as soon as the RST packet passed through fwbr811i0
, before it came out via fwln811i0
. When it reached vmbr0
, the connection was already gone, and the RST packet was considered invalid.
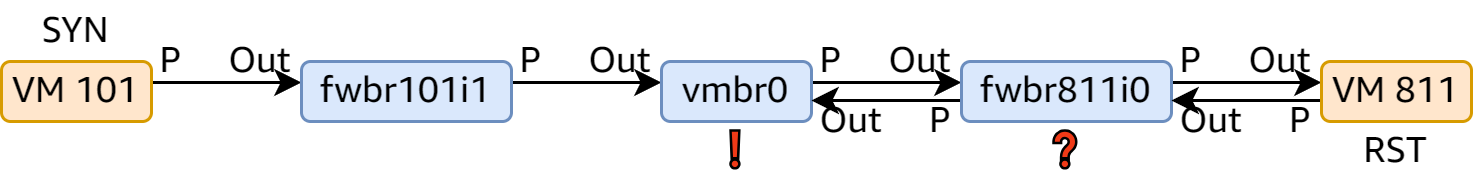
It also became explainable how firewall=0
on the virtual network device remedied the issue: It removed an extra bridge fwbr811i0
, so the connection stayed alive when the RST packet reached vmbr0
, at which point a previous rule for --ctstate ESTABLISHED
gave an ACCEPT
verdict. While it was still INVALID
when passing through fwbr101i1
, there was no rule concerning --ctstate
at play, so it slipped through this stage with no problem.
After double-checking the intention of the extra fwbr*
bridge, I drew the conclusion that this must be a bug with PVE Firewall. I reported it on the Proxmox VE bug tracker as #4983, and soon received a reply:
Thank you for the detailed write-up!
This is a known limitation for our kind of firewall setup, since the conntrack is shared between all interfaces on the host.
[…]
If you know of any other way to avoid this happening, other than using conntrack zones, I’d be happy to take a look.
So they admitted that this was a limitation but without a satisfactory solution. Guess I’m still on my own, though.
The actual problem is, when passing through fwbr811i0
, the RST packet isn’t supposed to be processed by conntrack by then. There is no sysctl
option to disable conntrack on a specific interface (or even just all bridges altogether), but at the right time the rarely-used raw
table came to my mind. It didn’t take long to work this out:
iptables -t raw -A PREROUTING -i fwbr+ -j CT --notrack
After verifying this is the intended solution, I added it as a reply to the bug report. At the time of writing this blog post, the bug report is still open, but I’m sure it’s to be resolved soon.
Debugging Linux networking has always been a pain for its lack of proper tools and its complexity. Most of the times even reading and understanding packet captures requires immense knowledge of the protocols and all the involved components, as well as scrutinizing every single detail available. Sometimes it’s even necessary to think outside the box but fortunately not today.
Also worth mentioning is that it’s easy to suspect the fault of another piece of software, but detailed investigation is always necessary to actually lay the blame.
Just as a late reminder, useful bug reports always require detailed information and solid evidence. Glad I was able to have them at hand this time.
]]>In previous times, OpenVPN was the general preference for personal VPN services. Since the emergence of WireGuard, however, popularity has shifted significantly for its simplicity and performance. A challenge presents itself as there’s only one UDP port numbered 53, making it seemingly impossible to run both OpenVPN and WireGuard on the same port.
There solution hinges itself on a little bit of insights.
In a similar situation, many local proxy software like Shadowsocks and V2ray support a feature called “mixed mode”, which accepts both HTTP and SOCKS5 connections on the same TCP port. This also seems impossible at first glance, but with a bit of knowledge in both protocols, it’s actually easy to pull it off.
GET
or CONNECT
,0x04
for SOCKS4 or 0x05
for SOCKS5.Now there’s a clear line between the two protocols, and we can identify them by looking at the first byte of the request. This is how most proxy implementations work, like 3proxy and glider.
So the question is, is there a similar trait between OpenVPN and WireGuard? The answer is, as you would expect, yes.
WireGuard runs over UDP and defines 4 packet types: 3 for handshake and 1 for data. All 4 packet types share the same 4-byte header:
struct message_header {
u8 type;
u8 reserved_zero[3];
}
Similarly, all OpenVPN packet types share the same 1-byte header:
struct header_byte {
uint8_t opcpde : 5;
uint8_t key_id : 3;
}
It’s worth noting that 0 is not a defined opcode, so the smallest valid value for this byte is 8, as key_id
can be anything from 0 to 7.
Now that we have the packet format for both protocols understood, we can implement a classifier that filters traffic in one protocol from the other.
Considering that the WireGuard packet format is much simpler than that of OpenVPN, I choose to identify WireGuard. With kernel firewall iptables
, options are abundant, though I find u32
the easiest:
*nat
:iBugVPN - [0:0]
-A PREROUTING -m addrtype --dst-type LOCAL -p udp --dport 53 -j iBugVPN
-A iBugVPN -m u32 --u32 "25 & 0xFF = 1:4 && 28 & 0xFFFFFF = 0" -j REDIRECT --to-port 51820
-A iBugVPN -j REDIRECT --to-port 1194
COMMIT
With both OpenVPN and WireGuard running on their standard ports, this will redirect each protocol to its respective service port. While these rules only operate on the initial packet, Linux conntrack will handle the rest of the connection.
The u32
match is explained:
<offset> [operators...] = <range>
, where <offset>
is relative to the IP header. For UDP over IPv4, the application payload starts from 28 (20 bytes of IPv4 and 8 bytes of UDP)25 & 0xFF = 1:4
: The 28th byte is in range 1:4
.28 & 0xFFFFFF = 0
: The 29th to 31th bytes are all zero.For IPv6, you just need to increase the offset by 20 (IPv6 header is 40 bytes), so the rule becomes 45 & 0xFF = 1:4 && 48 & 0xFFFFFF = 0
.
This VPN server is running like a hearse so proofs are left out for brevity.
]]>iBug @ USTC
2023 年 8 月 19 日
南京大学
计算机实验的环境配置问题:
能不能通过提供预先配置好实验环境的虚拟机来解决这个问题呢?
-m conntrack --ctstate NEW -j NFLOG
add_file
, add_package
, run
等“指令”Lxcfile
DSL 了不开放端口,各种协议都需要转发
VNC, SSH, and what?
ssh -i vm-114514.pem ubuntu@vlab.ustc.edu.cn
golang.org/x/crypto/ssh
ssh recovery@vlab.ustc.edu.cn
pct enter <vmid>
ssh console@vlab.ustc.edu.cn
pct console <vmid>
ssh serial@vlab.ustc.edu.cn
qm serial <vmid>
co_await
,……vlab.ustc.edu.cn
(标准端口 5900/tcp)PB17000001:114514
(用户名 + VM ID,如果用户有多个 VM 的话)loadbalanceinfo
/opt/vlab
VG test 1723 metadata on /dev/sdc1 (521759 bytes) exceeds maximum metadata size (521472 bytes)
Failed to write VG test.
%wa
)午夜准时爆炸
替用户停掉了 man-db.timer
和 apt-daily-upgrade.timer
,
给 logrotate.timer
补上了 RandomizedDelaySec=3h
。
nofailback
)LD_PRELOAD
+= libudev.so.1
LD_PRELOAD
+= libdbus-glib-1.so.2
本页面的链接: ibug.io/p/59
This article will be a remix of the original blog, with some of my own experiences blended in.
As a courtesy, here’s the disclaimer from the original blog:
警告:下面的設定不應該被應用於有重大價值的伺服器上面!這只是筆者強行在便宜硬件上塞進PVE並以更暴力的方式去為其續命的手段。
WARNING: The following settings should not be applied to valuable production servers! This is just a method for the author to force Proxmox VE onto cheap hardware and to prolong its life span.
Swap is the mechanism of offloading some memory from physical RAM to disk in order to improve RAM management efficiency. If you have a lot of physical RAM, chances are swap isn’t going to be much helpful while producing a lot of writes to the disk. On a default Proxmox VE installation, the swap size is set from 4 GB to 8 GB, depending on your RAM capacity and disk size.
You can temporarily disable swap by setting sysctl vm.swappiness
to 0:
sysctl vm.swappiness=0
Or why not just remove the swap space altogether?
swapoff -a # disables swap
vim /etc/fstab # remove the swap entry
lvremove /dev/pve/swap # remove the swap logical volume
In most cases, you won’t need swap on a Proxmox VE host. If you find yourself needing swap, you should probably consider upgrading your RAM instead.
Every system produces logs, but Proxmox VE is particularly prolific on this. In a production environment, you’ll want to keep the logs by storing them on a separate disk (but why is it running on an eMMC in the first place?). So get another reliable disk and migrate the logs:
# assuming the new disk is /dev/sdX
systemctl stop rsyslog
mount /dev/sdX1 /var/log1
rsync -avAXx /var/log/ /var/log1/
rm -rf /var/log
mkdir /var/log
umount /var/log1
vim /etc/fstab # add an entry for /dev/sdX1
systemctl daemon-reload # see notes
mount /var/log
systemctl start rsyslog
Notes on the above commands:
cp
if you need to perform a non-trivial copy operation. (The original blog uses cp
.)fstab
guarantees any mounts are consistent and persistent across reboots.Why systemctl daemon-reload
after edting fstab
? Because systemd is sometimes too smart (I got bitten by this once).
On a hobbyist setup, you may be fine with disabling logs altogether.
The original blog suggests replacing a few file with symlinks to /dev/null
, which I find rather incomplete and ineffective. On my 5-GB-used rootfs, /var/log
takes 1.8 GB, of which /var/log/journal
eats 1.6 GB alone, so systemd journal is the first thing to go. Editing /etc/systemd/journald.conf
and setting Storage=none
will stop its disk hogging, but better yet, you can keep a minimal amount of logs by combining Storage=volatile
and RuntimeMaxUse=16M
(ref).
If you’re on Proxmox VE 8+, you can create an “override” file for systemd-journald by adding your customizations to /etc/systemd/journald.conf.d/override.conf
. This will save some trouble when the stock configuration file gets updated and you’re asked to merge the changes.
For other logs, you can simply replace them with symlinks to /dev/null
. For example:
ln -sfn /dev/null /var/log/lastlog
I’m not keen on this method as other logs only comes at a rate of a few hundred MBs per week, so I’d rather keep them around.
The original blog suggests stopping a few non-essential services as they (which I couldn’t verify, nor do I believe so):
pve-ha-lrm
pve-ha-crm
pvefw-logger
Except for pvefw-logger
, stopping these services will not save you much disk writes as per my experiences.
rrdcached
writesrrdcached
is the service that stores and provides data for the PVE web interface to display graphs on system resource usage. I have no idea how much writes it produces, so I just relay the optimization given in the original blog.
/etc/default/rrdcached
:
WRITE_TIMEOUT=3600
so it only writes to disk once per hour.JOURNAL_PATH
so it stops writing journals (not the data itself).FLUSH_TIMEOUT=7200
(timeout for flush
command, not sure how useful it is).Edit /etc/init.d/rrdcached
for it to pick up the new FLUSH_TIMEOUT
value:
Find these lines:
${WRITE_TIMEOUT:+-w ${WRITE_TIMEOUT}} \
${WRITE_JITTER:+-z ${WRITE_JITTER}} \
And insert one line for FLUSH_TIMEOUT
:
${WRITE_TIMEOUT:+-w ${WRITE_TIMEOUT}} \
${FLUSH_TIMEOUT:+-f ${FLUSH_TIMEOUT}} \
${WRITE_JITTER:+-z ${WRITE_JITTER}} \
After editing both files, restart the service: systemctl restart rrdcached.service
pvestatd
pvestatd
provides an interface for hardware information for the PVE system. It shouldn’t produce much writes and stopping it will prevent creation of new VMs and containers, so I don’t recommend stopping it. The original blog probably included this option as a result of a mistake or ignorance.
We can see how Proxmox VE is designed to provide enterprise-grade reliability and durability, at the expense of producing lots of disk writes for its various components like system logging and statistics. Based on the above analysis, it seems perfectly reasonable that Proxmox VE decides not to support eMMC storage.
This blog combines a few tips from the original blog and my own experiences. I hope it helps you with your Proxmox VE setup on any eMMC-backed devices.
But really?
There’s one key question left unanswered by everything above: How much writes does Proxmox VE really produce?
To answer this question, let’s see some of my examples:
Specs:
Total writes as of July 2023 (rootfs-only, thanks to this answer):
# lrwxrwxrwx 1 root root 7 Jul 12 15:48 /dev/pve/root -> ../dm-4
# cat /sys/fs/ext4/dm-4/lifetime_write_kbytes
17017268104
Result: 4.5 TB annually.
Specs:
Total writes as of July 2023 (rootfs-only):
# lrwxrwxrwx 1 root root 7 Jan 21 2022 /dev/pve/root -> ../dm-1
# cat /sys/fs/ext4/dm-1/lifetime_write_kbytes
2336580629
Result: 1.5 TB annually.
Specs:
Total writes as of July 2023:
# smartctl -A /dev/sda
241 Total_LBAs_Written 2849895751
humanize.naturalsize(2849895751 * 512, format="%.2f")
: 1.46 TB (≈ 2 TB annually)
This one really depends on the hardware you get. In 2023 virtually every reasonable TLC flash chip should withstand at least 1,000 P/E cycles, so even a pathetic 8 GB eMMC should last around 10 TB of writes, as that on a Raspberry Pi Compute Module 4.
If you get anything larger than that, you should be fine expecting it to survive at least 20 TB of writes.
Congratulations on reading this far.
If you managed to hold your paranoia and refrain from putting anything into action, you can now sit back and relax. Unless you’re squeezing hundreds of VMs and containers into a single eMMC-driven board (poor board) without separate storage for VMs, your eMMC is not going to die anytime soon.
As the policies evolved, our school’s reporting platform also underwent changes. I had to update the reporting script multiple times with new features to align those of the reporting platform.
Much like my previous article, there’s a significant distinction between making something work and making it work with elegance. So in this article, I’ll share my infrastructure for the automated daily report system, and delve into some design options and decisions I made in the way.
Writing a script is about the easiest thing in the whole system with the least technical complexity. Anyone with basic scripting abilities can do it well, so I open-sourced mine. It only takes a few minutes to open the Developer Tools on your browser, identify the request originating from the [Submit] button, copy its payload out and put that into a script, and it’s ready to service. If anything marginally fancy were to be added, it’d be saving certain data to a separate file so that others can adopt the script more easily.
The next thing is to run the script every day at a desired time. A common solution is to use Cron that is simple and easy. Systemd timers is a modern alternative offering more features at the expense of a more complex configuration. I chose the latter for its RandomizedDelaySec
option, so that the script won’t be run at the exact same time every day.
At the beginning I also had a sample GitHub Actions workflow file so that others can fork my repository and start automating their reports with minimal effort. However, I scrapped it later on realizing it’s against GitHub’s ToS.
The next thing is to stay informed of whether the script is working properly. Logging in to the server and reading logs every day is not fun. Assuming that it worked and ending up being denied entry to the school is even worse. So it’d be nice to be notified of everything it does.
A common choice is via email, but it’s lacking a bit of timeliness. I chose Telegram because I’m actively using it and it provides a bot API. Adding python-telegram-bot
to the script and a few lines of code, I can get a notification on my Telegram every time the script runs.
My actual setup differs slightly, with an extra component between the script and the bot: an AWS Lambda serverless function. I did this for two reasons:
api.telegram.org
) is not directly accessible from mainland China for well-known reasons.requests.post
.As a bonus feature, I also send the error message and the line number in case of an exception, so that I can quickly identify the problem before investigating the logs.
[THU Checkin] Success: 2023-02-24 20:42:23
Checkin: Success
Apply: Success
[THU Checkin] ❌ Error: 2023-02-25 20:05:46
AttributeError: ‘NoneType’ object has no attribute ‘group’
Oncheckin.py
line 67
Sometime later, our school began to demand regular uploads of our health QR code. The QR code is generated by a govermental mobile app whose retrieval is, unfortunately, difficult to automate. Before stepping over the line of producing fake QR codes, I decided to take the screenshots manually and have my script upload them to the reporting platform. The good news is, there’s no measures on the platform to validate the uploaded images, so uploading an outdated screenshot yields no consequences most of the time, and I don’t have to constantly update the screenshots for the script.
Image uploading is nothing new to the requests
Python library, but I have to deliver the files from my phone somehow. Options to transfer files from an Android phone to a Linux server are abundant, and for me I found SMB the most convenient. Root Explorer is the file manager that I’ve been using for a decade, so I could just set up Samba on my server to receive the files from it.
[THU Checkin] Success: 2023-02-25 08:33:36
Checkin: Success
Apply: Success
Image 1: Skipped
Image 2: Success
Image 3: Success
Alternatively, I could have my Telegram bot accept the images and forward them to the server. This would be more convenient in terms of using, but much less in coding as I didn’t have any existing code in my Telegram bot that handles images. Meanwhile, I already had Samba running on my server so I in fact did not set it up anew.
At this point everything is operational, with one detail missing: The SMB protocol is not known for being secure. Exposing the SMB port to the Internet is prone to troubles and connecting to a VPN every time is not convenient. Luckily I have Clash for Android running on my phone 24/7 that I can use to proxy Root Explorer. I set up a shadowsocks-libev server and configured Clash to route traffic targeting my server through it, and then closed the SMB port in my server firewall.
There’s a noteworthy thing about Clash: It’s a rule-based proxy software that reads configurations. My airport1 service provides their configuration through a subscription URL, but Clash for Android doesn’t support editing subscribed config. Another background story comes up here: I have another Lambda function serving as my own Clash config subscription. It fetches the airport config and modifies it to my preferences, and then serves it to Clash. It also makes updating the config easier, as I can just update the Lambda function code and the changes will be reflected in Clash.
Fun fact: My custom subscription is also used with Clash for Windows on my computer, which helped me completely bypass two RCE vulnerabilities (1, 2).
After all this complexity, here’s what I’ve got:
The script runs every day at a random time in a configured time span, and I get a notification on Telegram regardless of whether it succeeds or fails. If the script fails I also have the required information to look into it. The script also uploads the health QR code screenshots to the reporting platform, and I can update the images from my phone through a secured connection.
Of all these tasks, only taking the screenshots and uploading them to the server is manual, denoted in the image by blue arrows. All black arrows are automated and require no attention to function.
As the zero-COVID policy came crumbling down in December 2022, our school also put an end to the daily health reporting system. As a result, I can safely share my setup here without fearing repercussions. I hope this article brings you some inspiration for your next automation project.
During the days around the strictest lockdown of campuses, all students’ requests for outgoing were manually reviewed by two levels of authority, with the second level being the dean. Our department consists of over 2,000 students that kept submitting requests every day. Needless to say, many staff weren’t happy about this, and the dean in particular. We were once asked to stop phoning her as she was already processing the requests from 7 AM to 11 PM every day. To everyone’s relief, the reviewing process was cancelled in a few days and requests were automatically approved thereafter.
Shadowsocks service providers are commonly called “airports” because the icon of Shadowsocks is a paper plane, and every provider has multiple “plane servers” that you can use. ↩